
3.10Graph
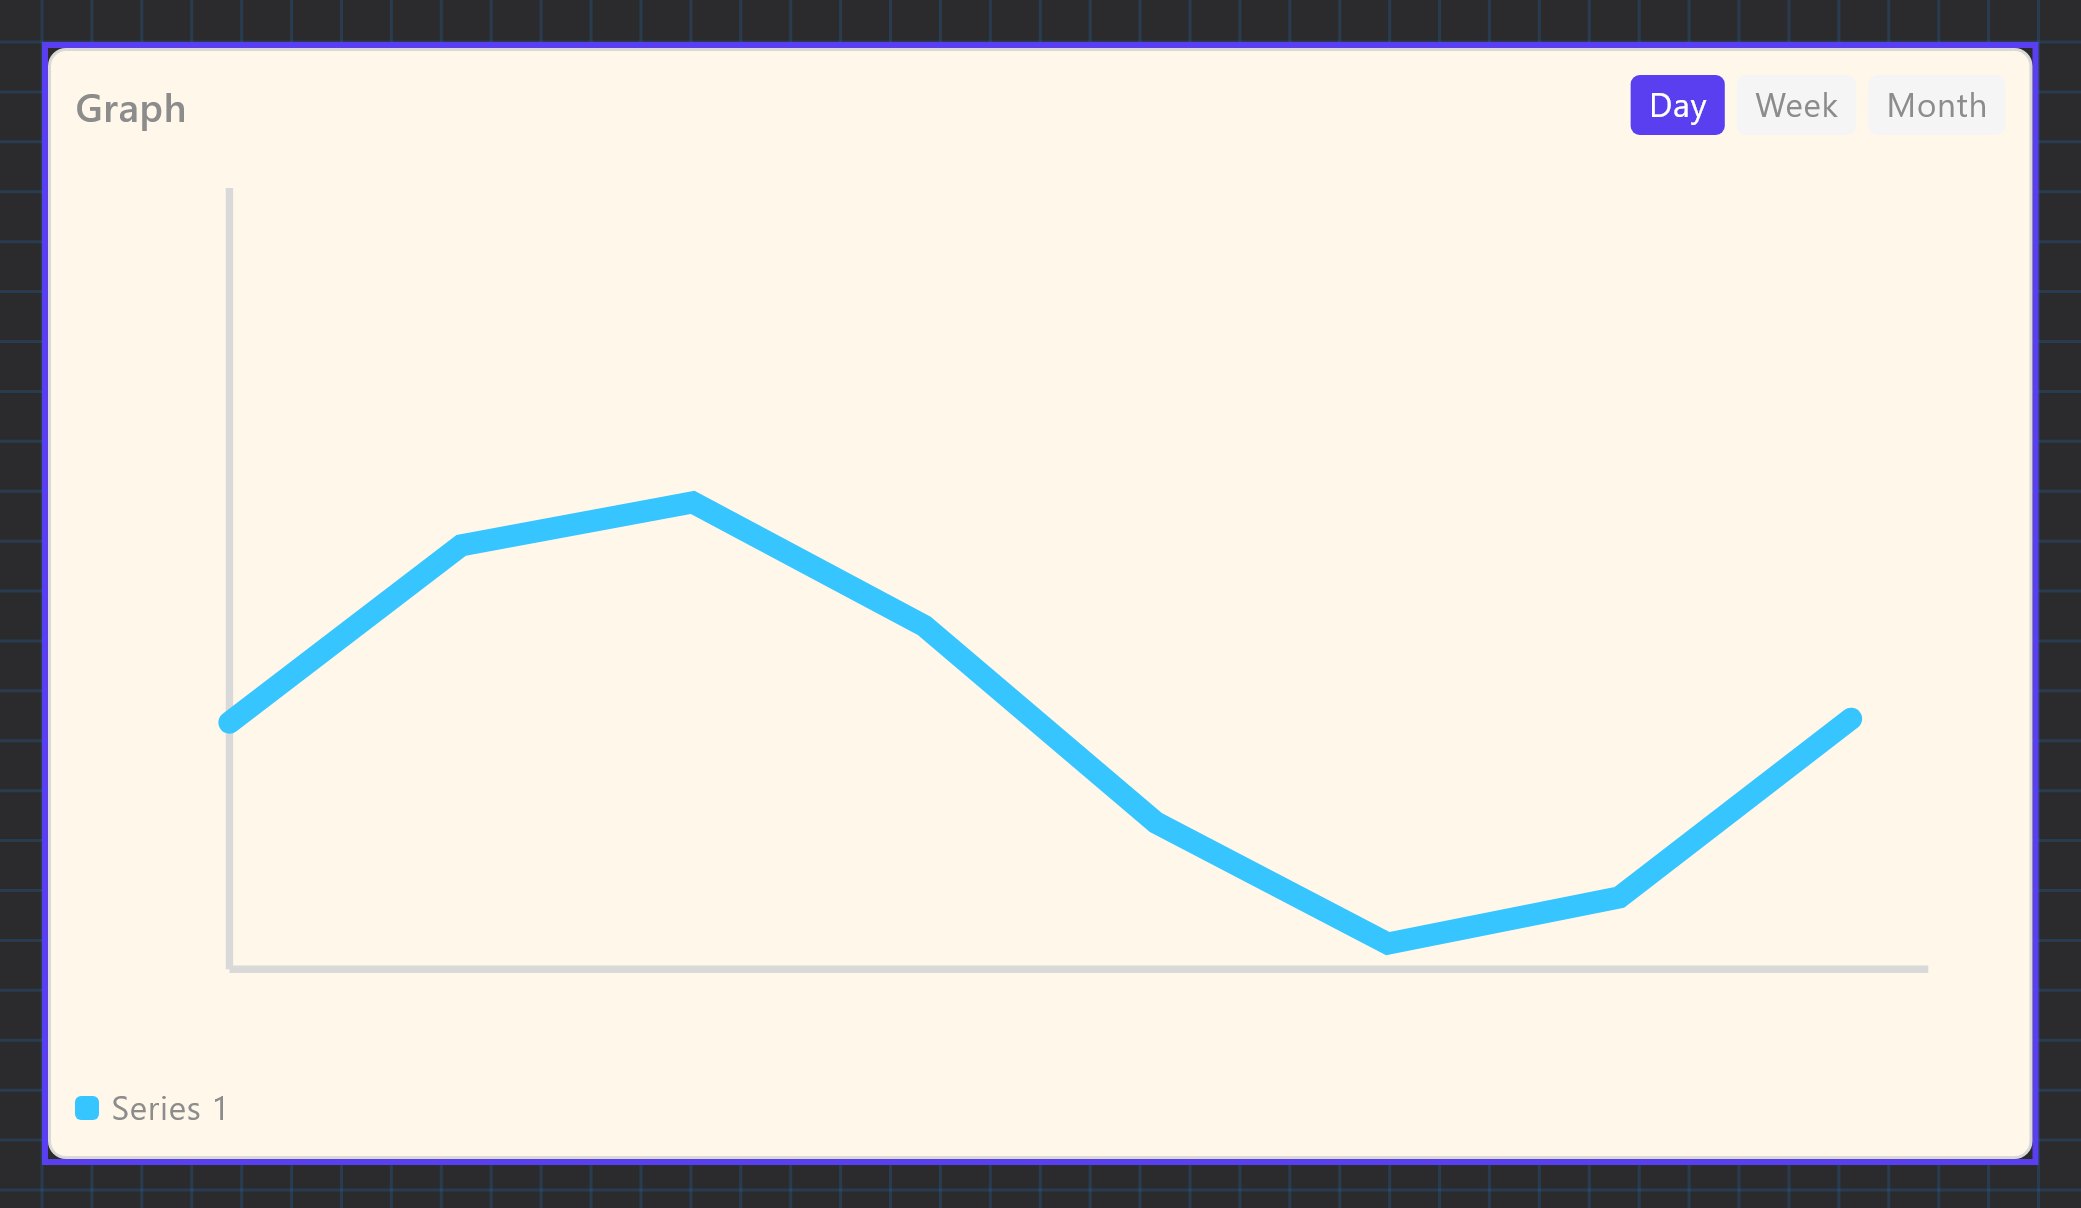
A line chart of recorded values over a day, a week or a month, with a date stepper and a hover read-out.
The Graph object draws one or more recorded values as coloured lines. The user switches between Day, Week and Month and steps back through earlier dates. The data comes from the gateway's History Recorder, not from the live value.
#When to use it
Use it for trends that matter to the customer: energy use, temperature, voltage on three phases, tank level. For a single live number use an Analog Value. The Graph cannot show a value that is not being recorded, so decide what to record before you place it.
#What you need first
The Graph can only list values that the History Recorder records.
- In the Server tree open Internal services > History Recorder and turn Enabled on. A recorder that is not enabled stores nothing.
- Leave Storage Target on Gateway local history store (the default). The Graph reads the history kept on the gateway.
- Click Configure Recorded Values (N), then Add, and fill in the value: Name, Unit of measure, Multiplying factor, Source (KNX, Modbus or Zigbee), Type (the DPT), the KNX group or System Object, and how it is stored.
- Store trigger options are: On every value update, After a fixed interval (default, Interval (seconds) 300, range 5 to 86400), When change exceeds threshold (Change Threshold (%), default 5), or Threshold or fixed interval.
- Value to store options are: Last received value (default), Rate of change, Accumulated value, Simple average, Time-weighted average.
- Deploy the project and let the gateway run for a while: the chart is empty until samples exist.
Recorded values are averaged as they age (the defaults keep every sample for 1 day, then average per 6 hours after 1 week, per day after 1 month, and so on), so older Week and Month ranges look smoother than today's Day view.
#Properties
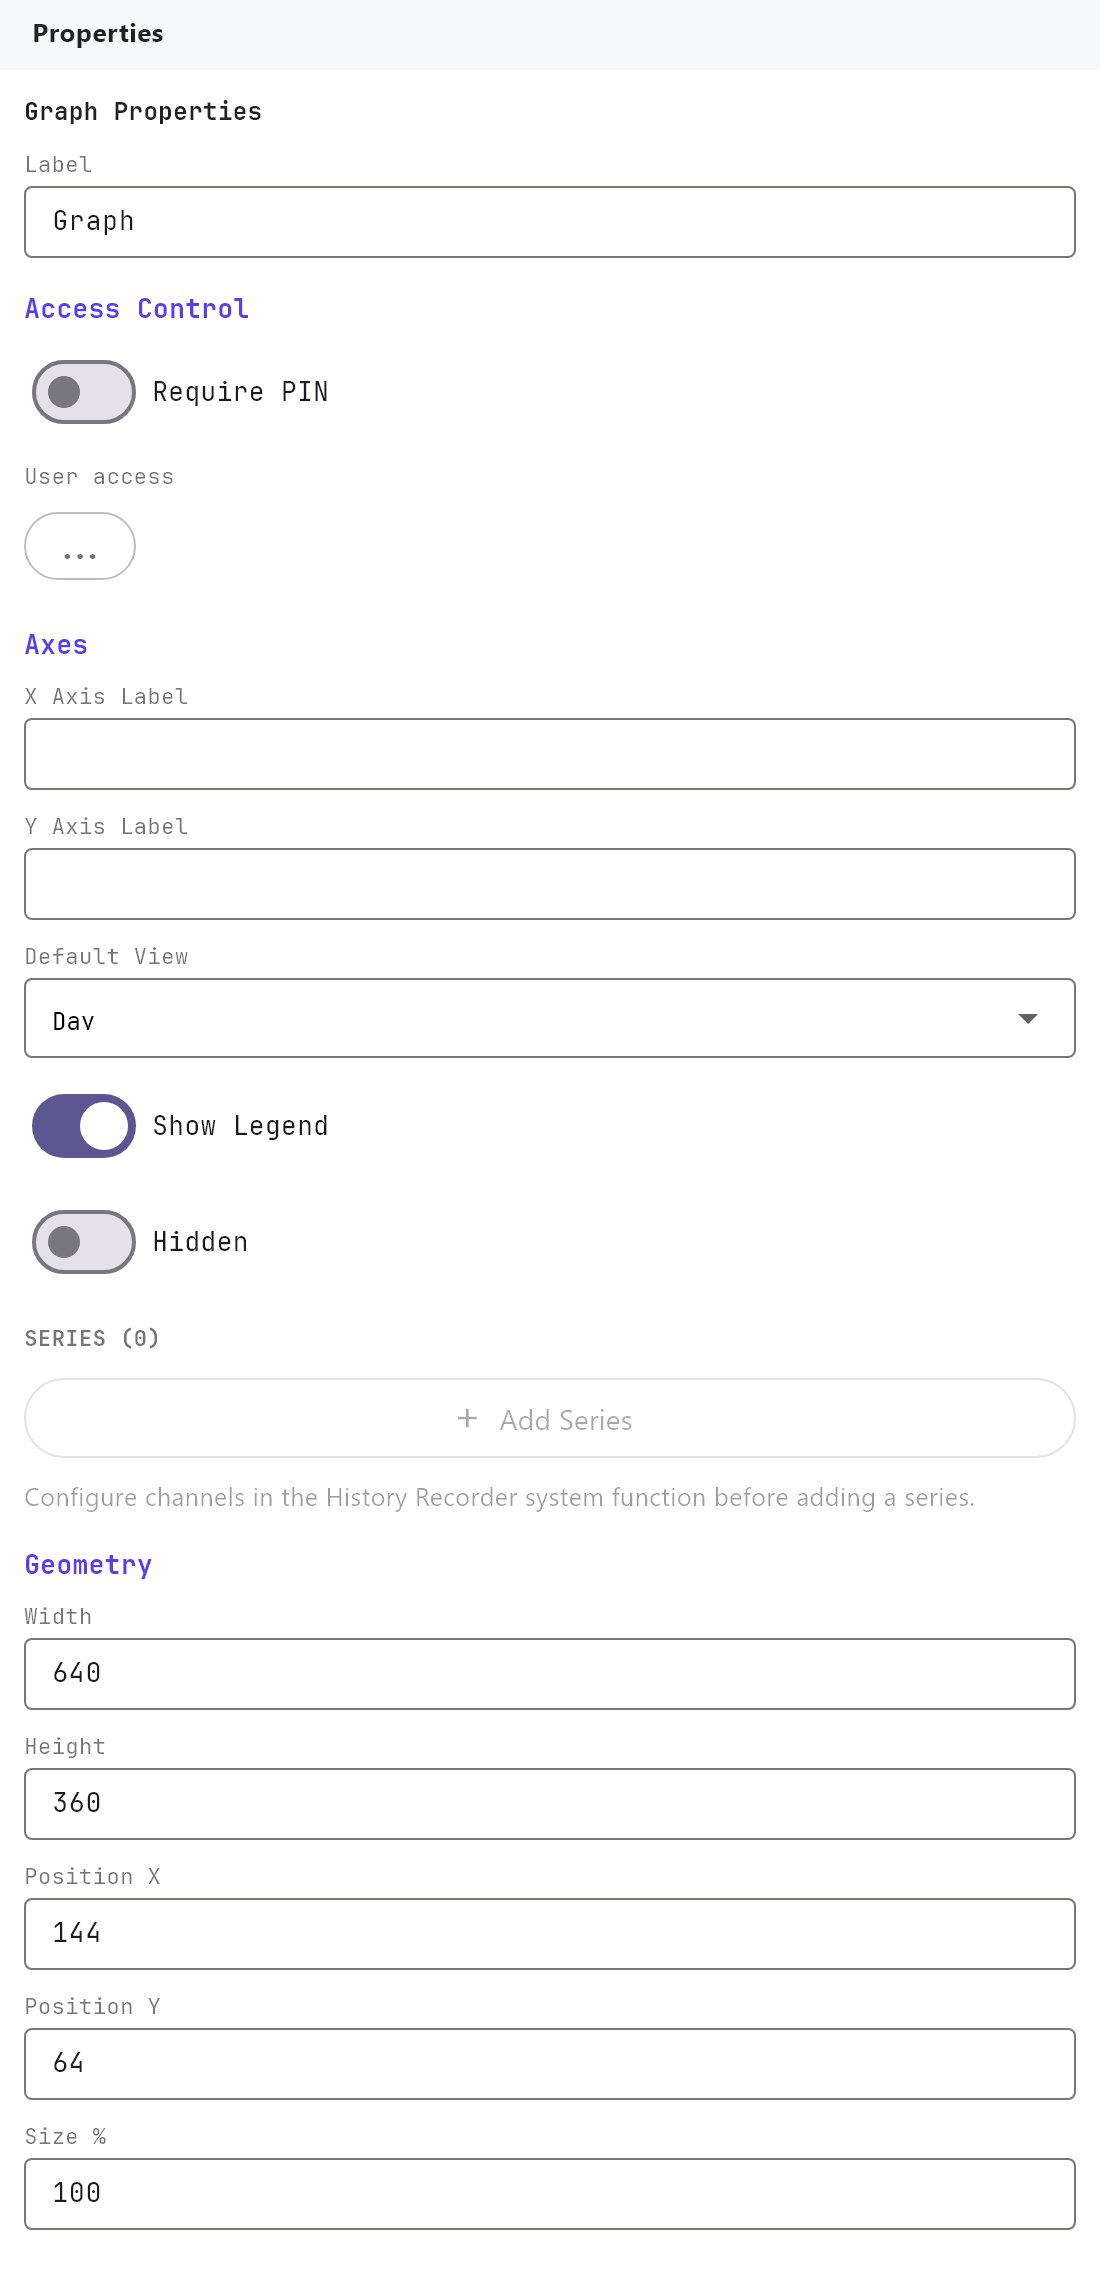
The Label, Access Control, Width, Height, Position X, Position Y and Size % fields work as described in Common properties. The Label is the title at the top left of the chart. The default size is 640 by 360. The Text Style fields and Rotation appear in the panel but do not change how the chart is drawn.
#Axes
| Property | What it does |
|---|---|
| X Axis Label | Text drawn under the time axis. Empty by default. |
| Y Axis Label | Text drawn, rotated, beside the value axis. Empty by default. Put the unit here, for example kW. |
| Default View | The range shown when the page opens: Day (default), Week or Month. |
| Show Legend | On by default. The legend only appears when the graph has more than one series. |
| Hidden | Off by default. When on, the Graph is not drawn in the apps at all. |
#Series
Each series is one recorded value drawn as one line.
| Property | What it does |
|---|---|
| Add Series | Adds a series. The button is disabled until the History Recorder has at least one recorded value. |
| Recorded value (list) | Which recorded value this line shows. The list shows each name with its unit. |
| Colour | The line colour. New series cycle through cyan, orange, green, magenta, yellow and pink. |
| Series label (optional) | The name used in the legend and tooltip. If empty, the legend shows Series 1, Series 2 and so on, and the tooltip uses the recorded value's own name. |
| Delete (bin button) | Removes the series. |
#How it behaves in the apps
- Day shows the selected calendar day, Week the 7 days ending on it, Month the 31 days ending on it. The arrow buttons step back or forward by 1, 7 or 30 days and cannot go past today. The date between the arrows shows the selected day.
- All series share one time axis and one value scale. The scale fits the data with a 10 percent margin, so it does not start at zero. Only the highest and lowest values are labelled.
- With a mouse (Windows app or a browser) a vertical line and a tooltip follow the pointer and show the nearest value of each series with its unit and time. Touch screens have no hover read-out.
- The chart is loaded when you open the page or change the range. It does not update live while you watch.
- A range with no samples shows "No recorded data for this range".
#Example
Show the three phase voltages of the mains supply:
- In History Recorder, add three recorded values named
L1 voltage,L2 voltageandL3 voltage, Unit of measureV, SourceModbus, each bound to the matching datapoint of the energy meter, Store triggerAfter a fixed interval, Interval (seconds)300. - Add a Graph, Label
Mains voltage, Y Axis LabelV, Default ViewDay, Show Legend on. - Press Add Series three times, choose
L1 voltage,L2 voltageandL3 voltage, and set the series labelsL1,L2andL3.
#Tips and common problems
- Add Series is greyed out: no recorded value exists yet. Add them in the History Recorder first.
- The chart says there is no recorded data: the History Recorder is not enabled, the project was not deployed, or the source has not produced a value yet. For a KNX source, check the group address and the Type.
- Values look wrong by a fixed factor: set Multiplying factor on the recorded value (not on the Graph).
- The line looks too coarse: use a shorter Interval (seconds) on the recorded value. Very frequent recording uses more gateway storage.